
Product walkthrough
See how TradeChrono works
Seven steps through the real desktop interface. This is a screenshot walkthrough, not a downloadable Free Demo or an interactive trading terminal.
01 / 07
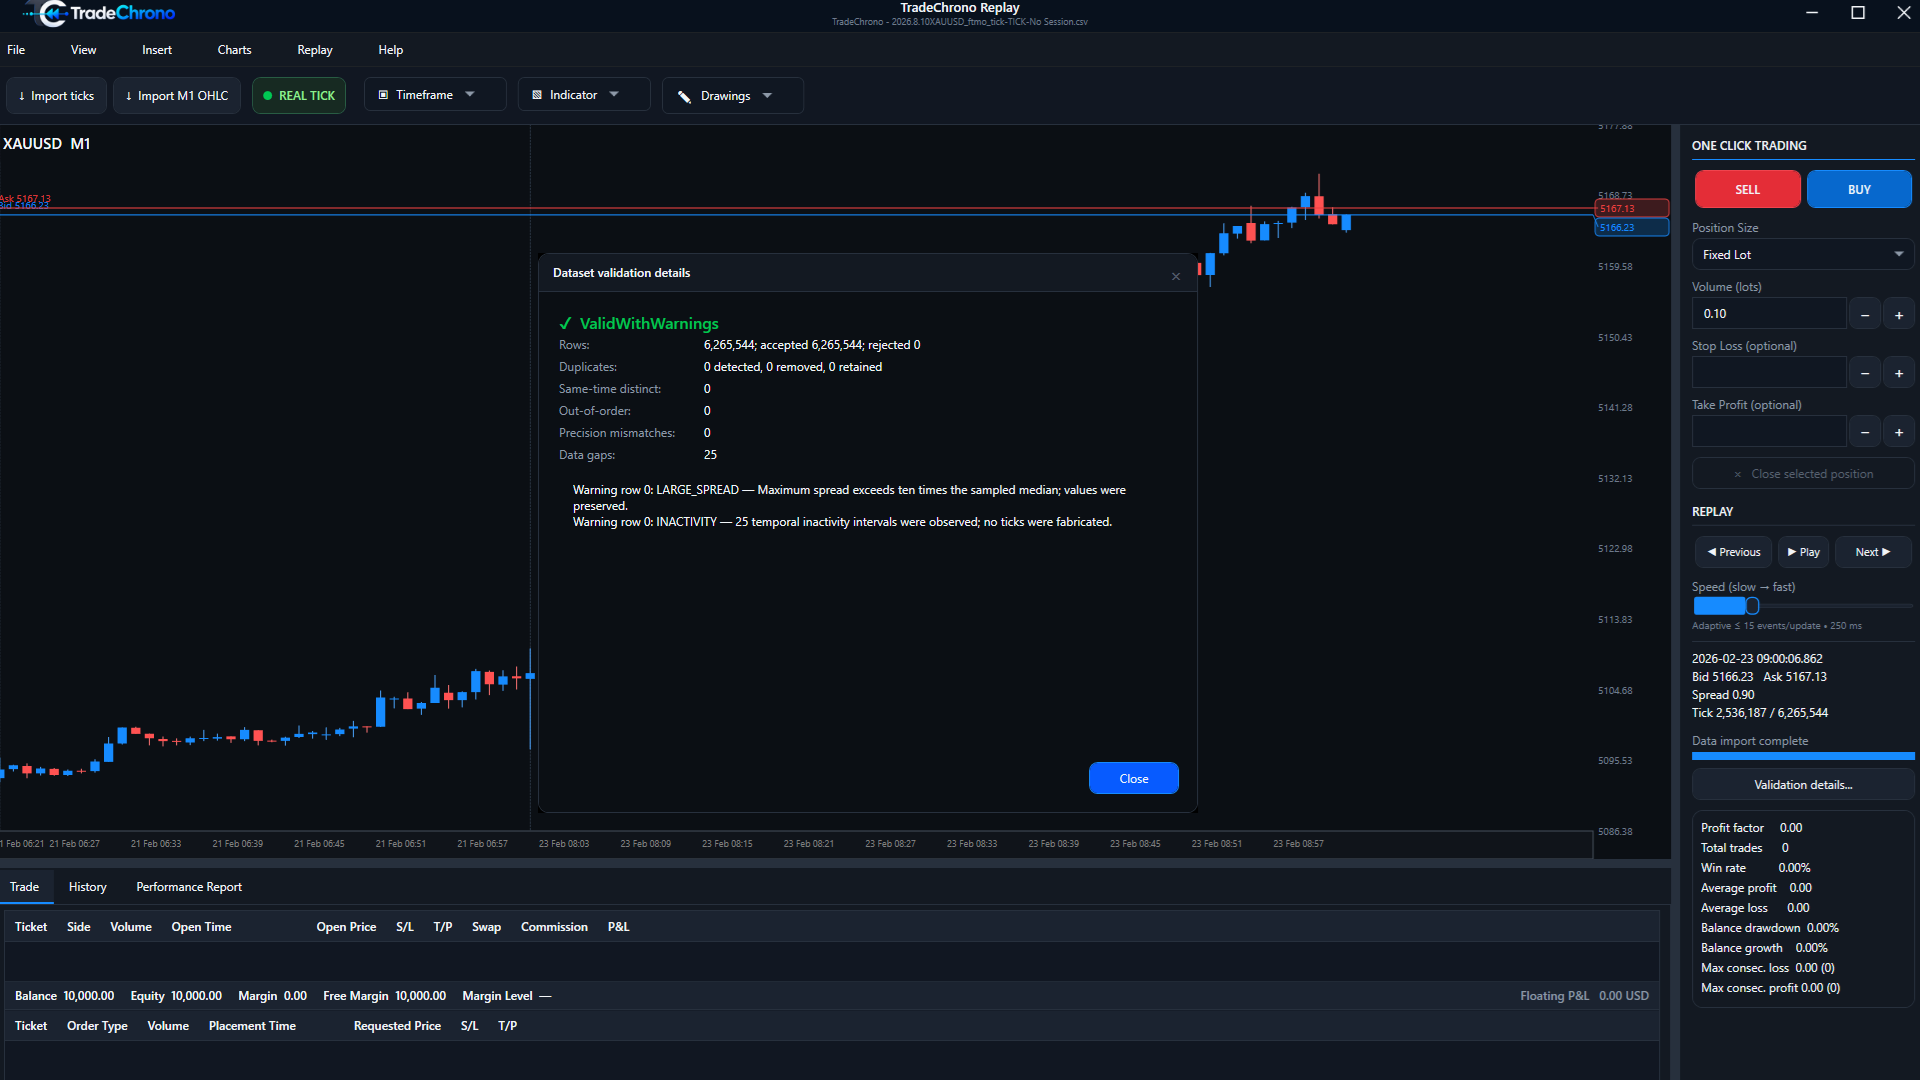
Import historical data
Load compatible historical data you are entitled to use. Inspect dataset validation before replay.
Real product screenshot · historical simulation 02 / 07
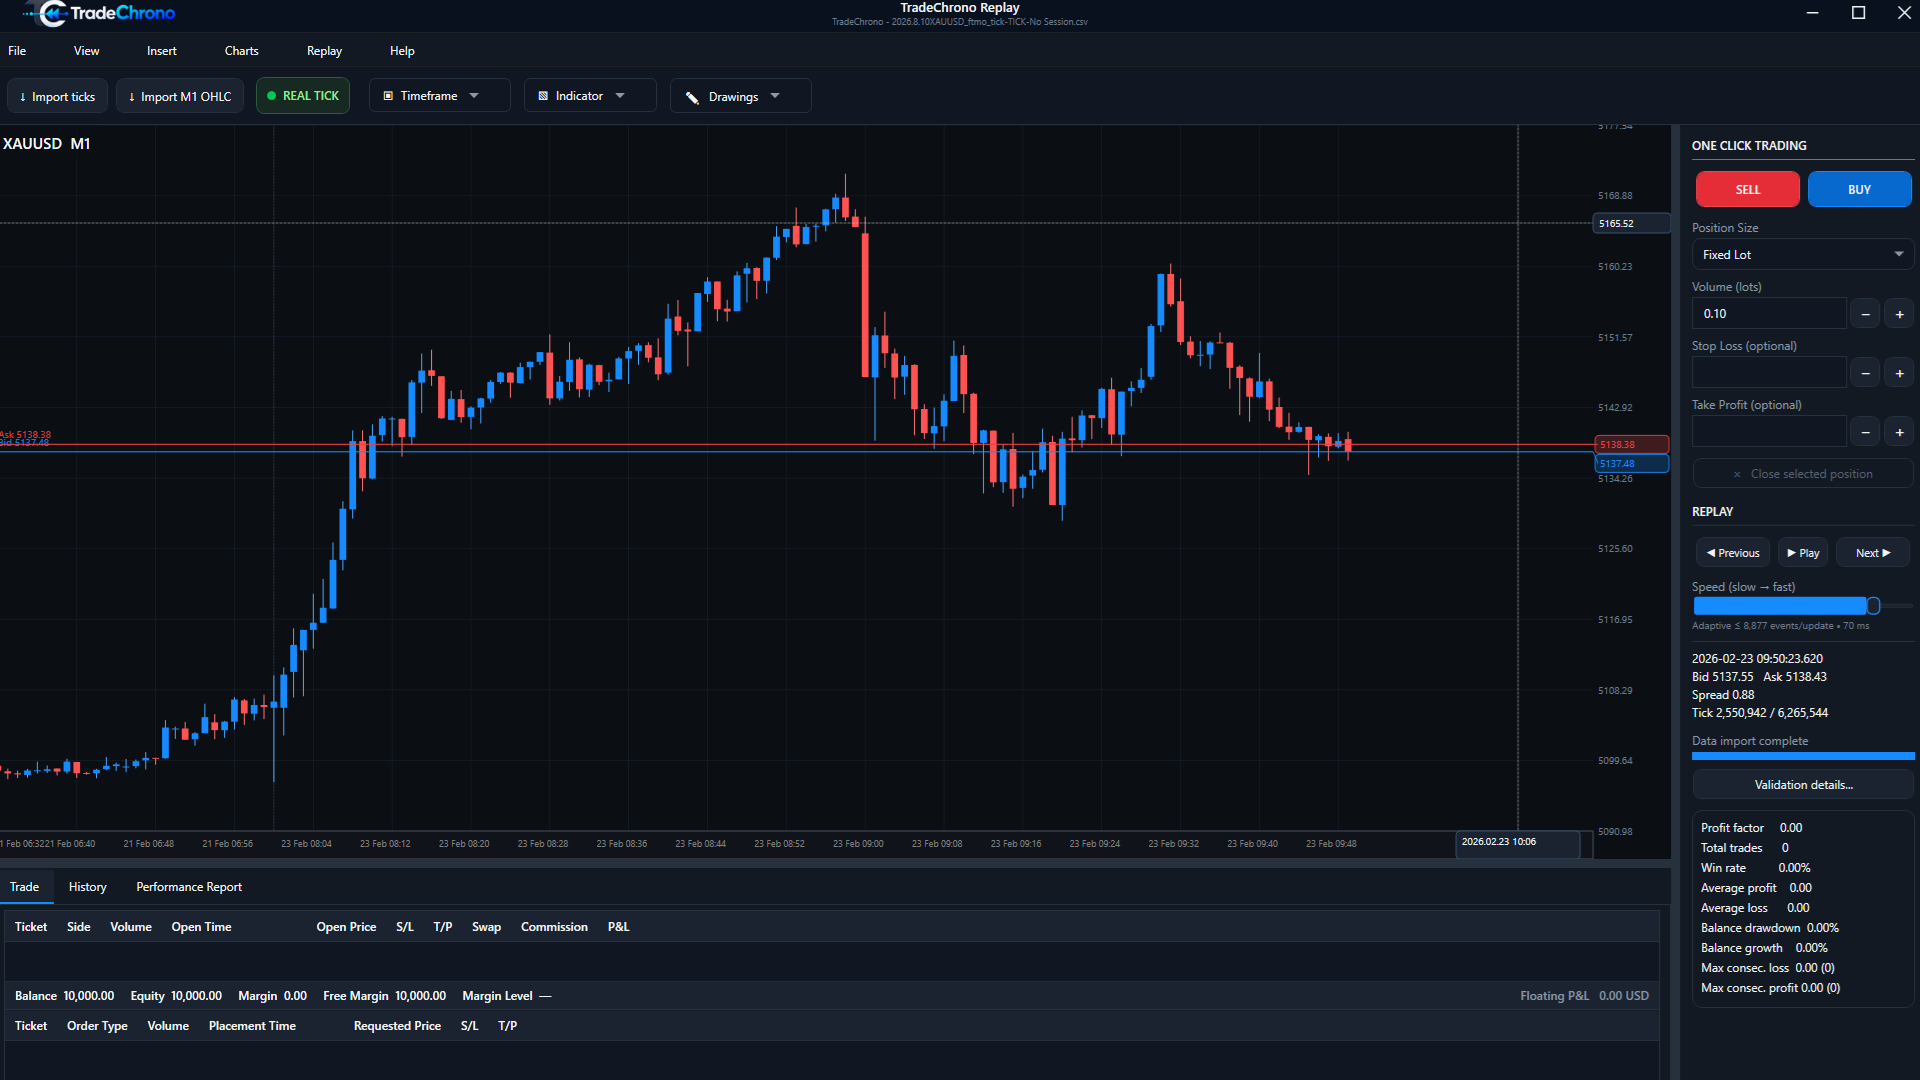
Start a replay
Choose a timeframe. Play, pause and adjust speed to inspect historical progression.
Real product screenshot · historical simulation 03 / 07
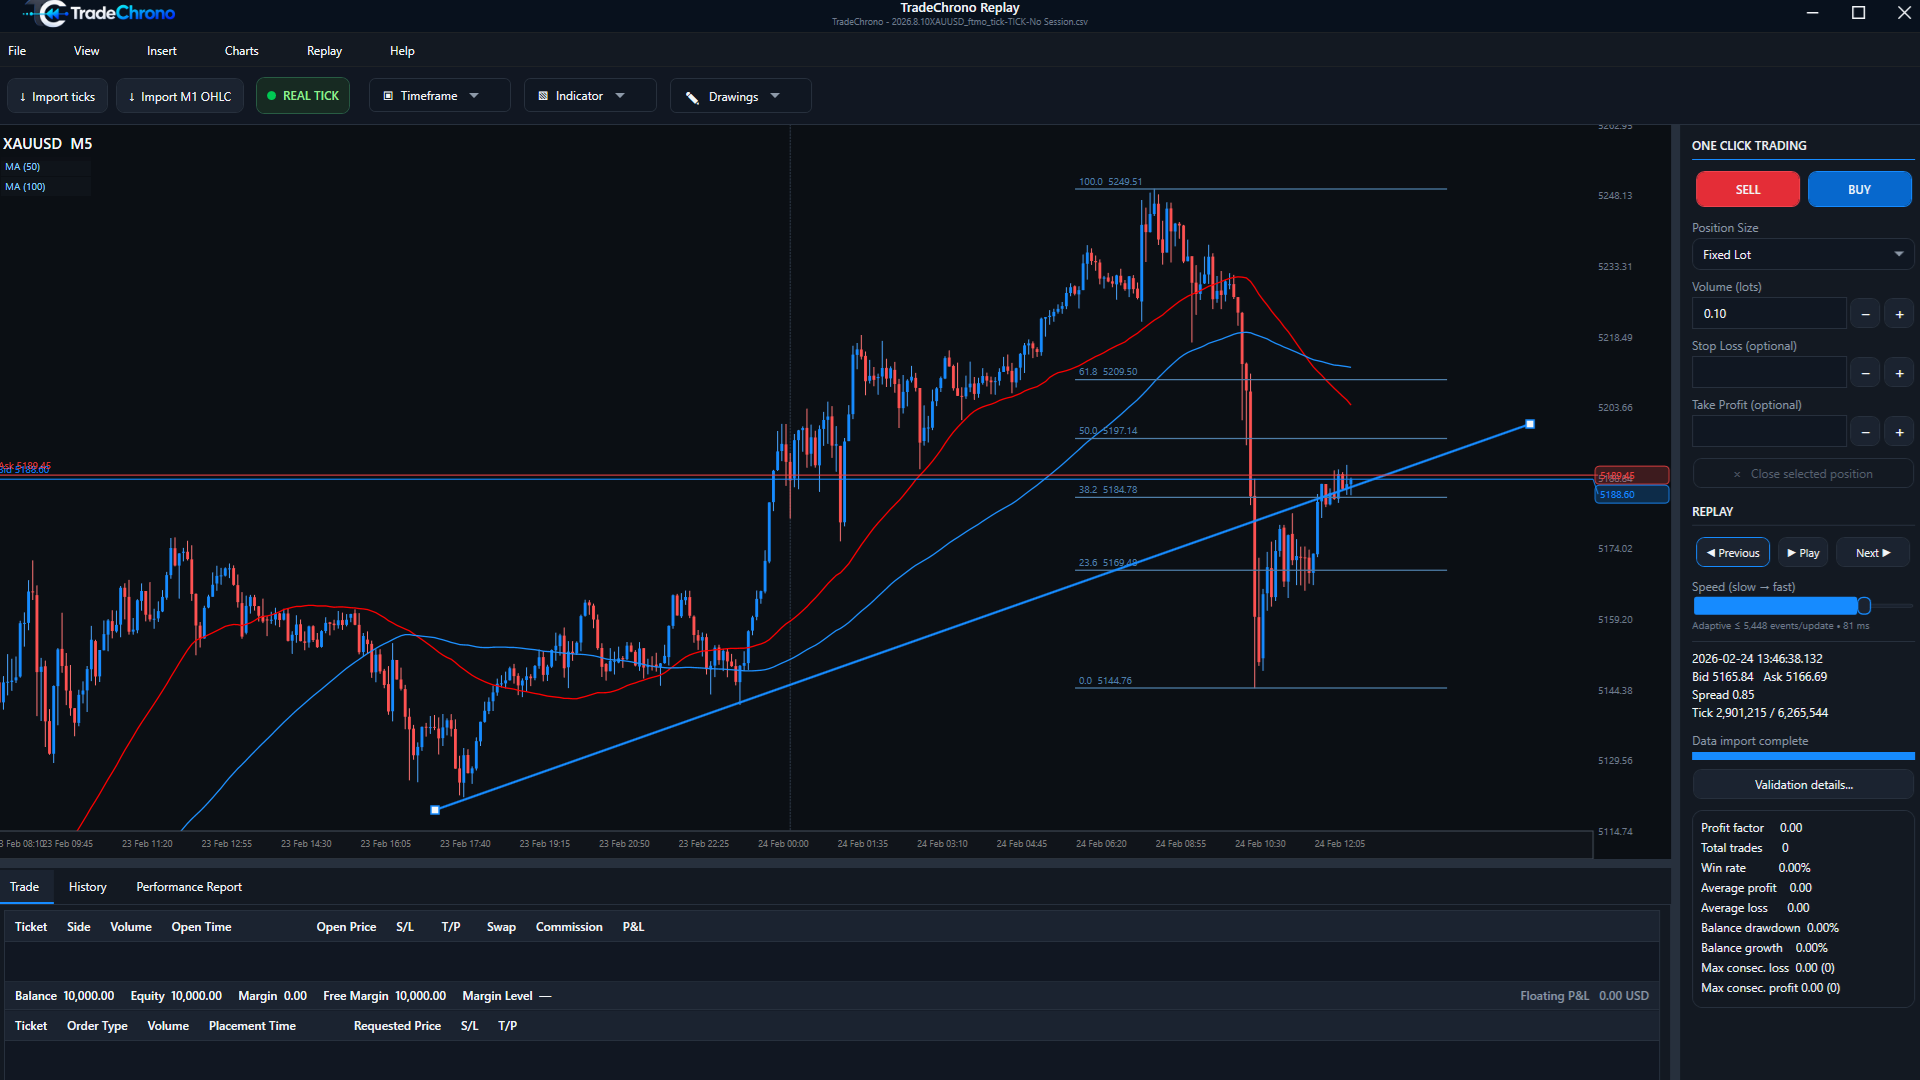
Analyze the market
Use indicators and drawings to record your setup before advancing the replay.
Real product screenshot · historical simulation 04 / 07
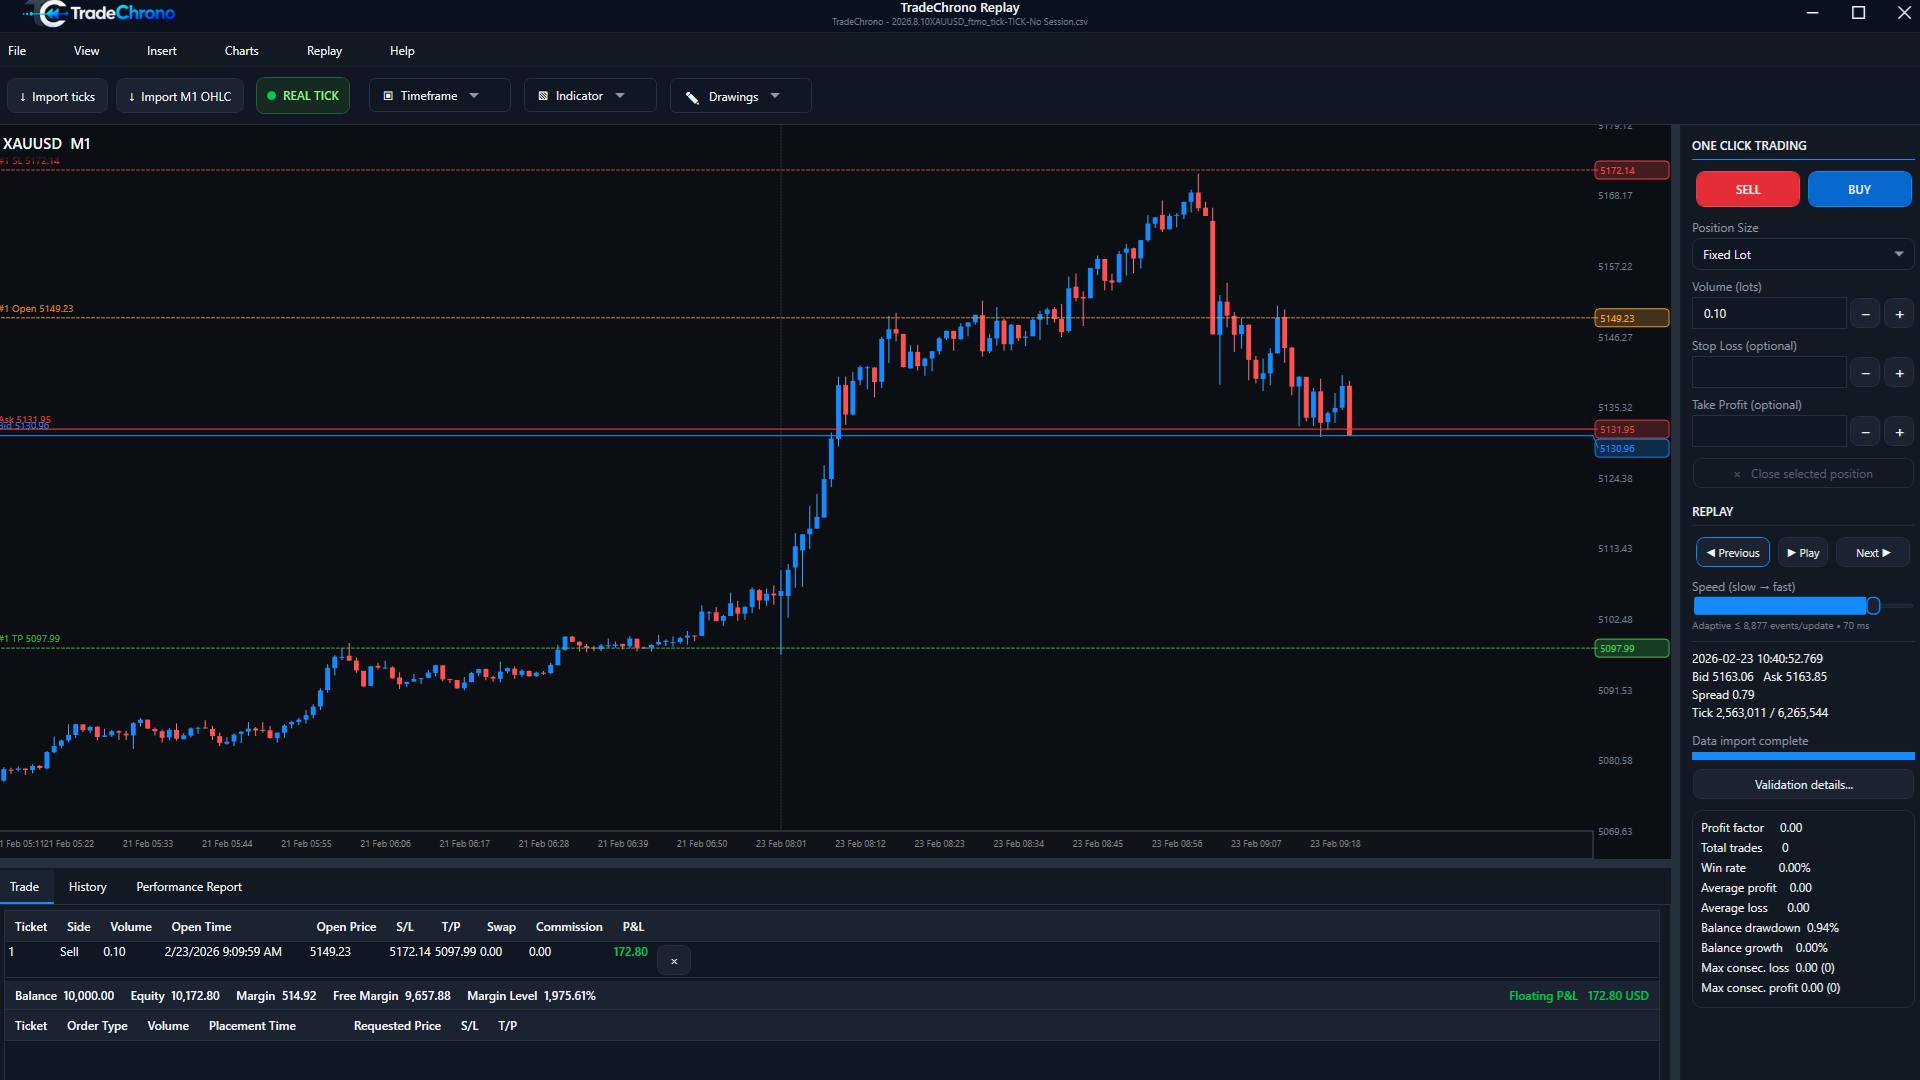
Place simulated trades
Choose side and volume. Orders remain inside the historical simulation, not a live brokerage account.
Real product screenshot · historical simulation 05 / 07
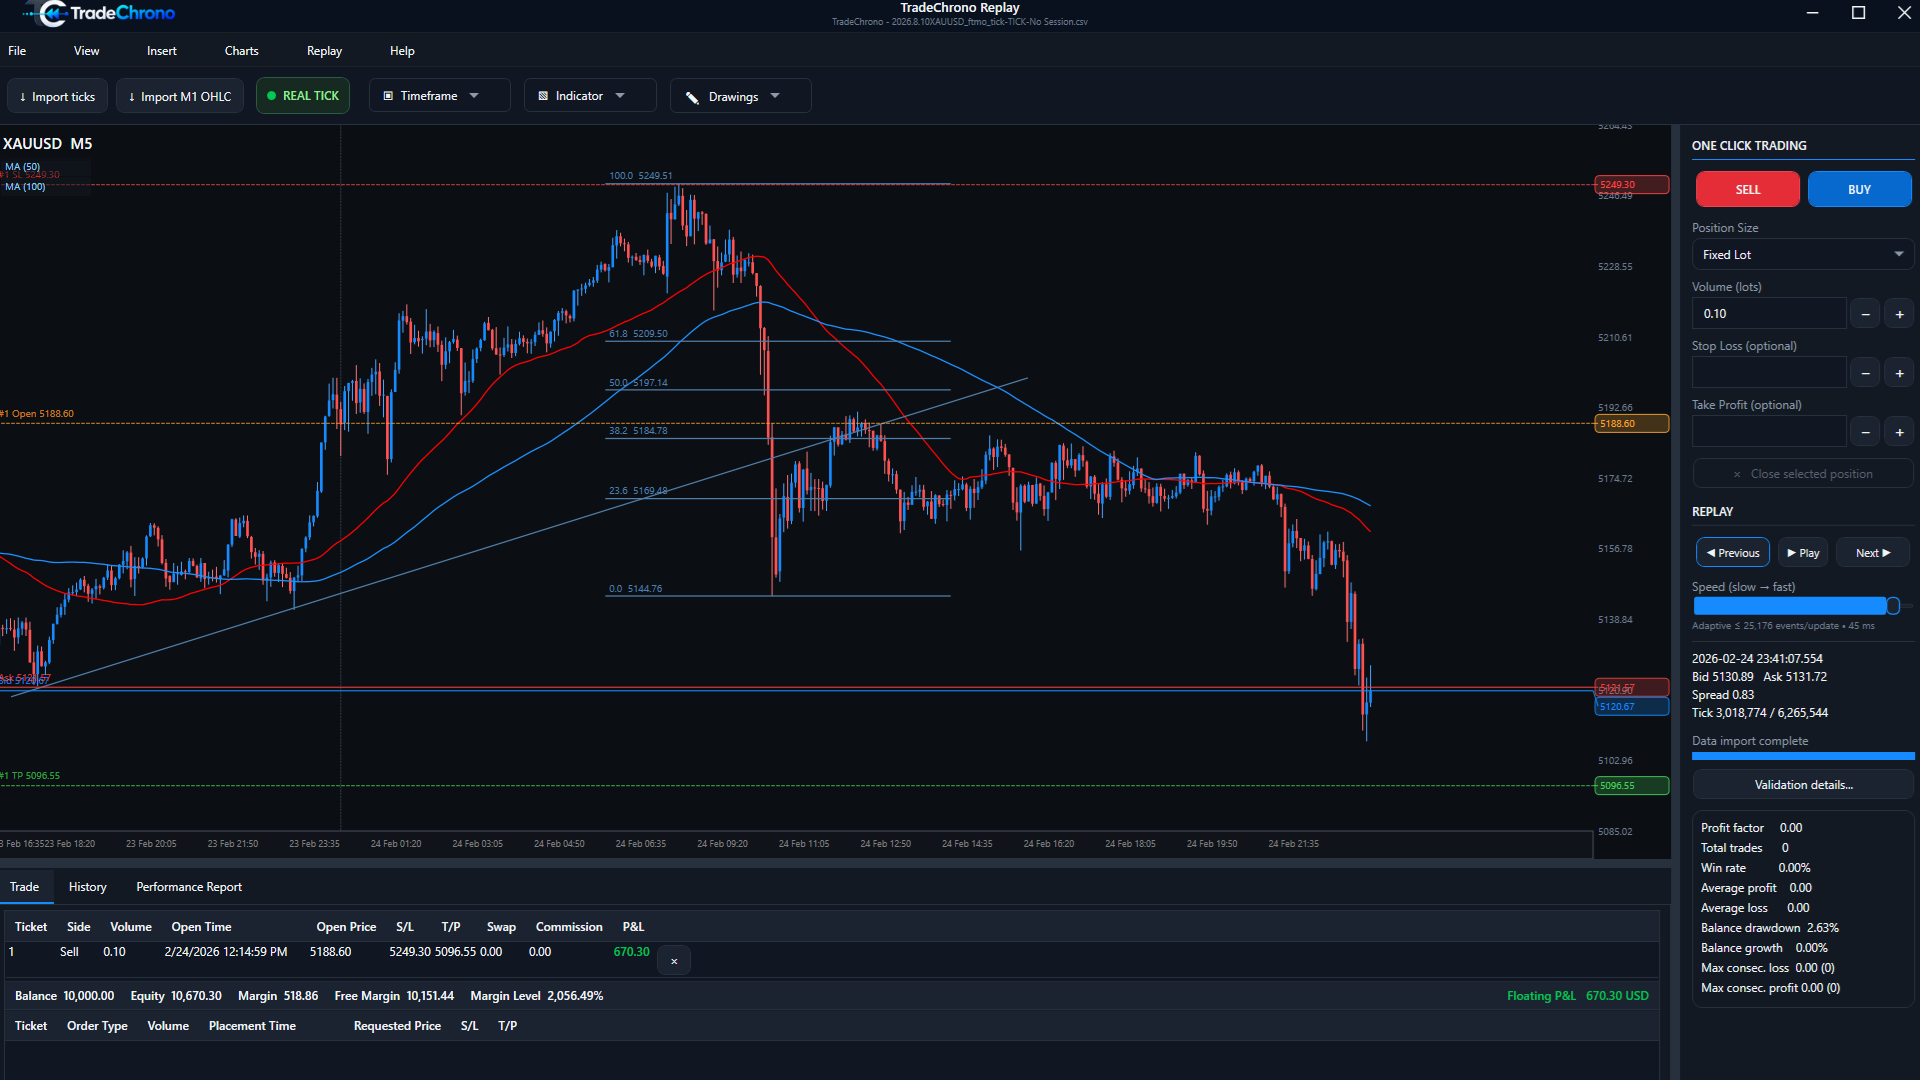
Manage SL and TP
Inspect Stop Loss, Take Profit and your open position as the replay progresses.
Real product screenshot · historical simulation 06 / 07
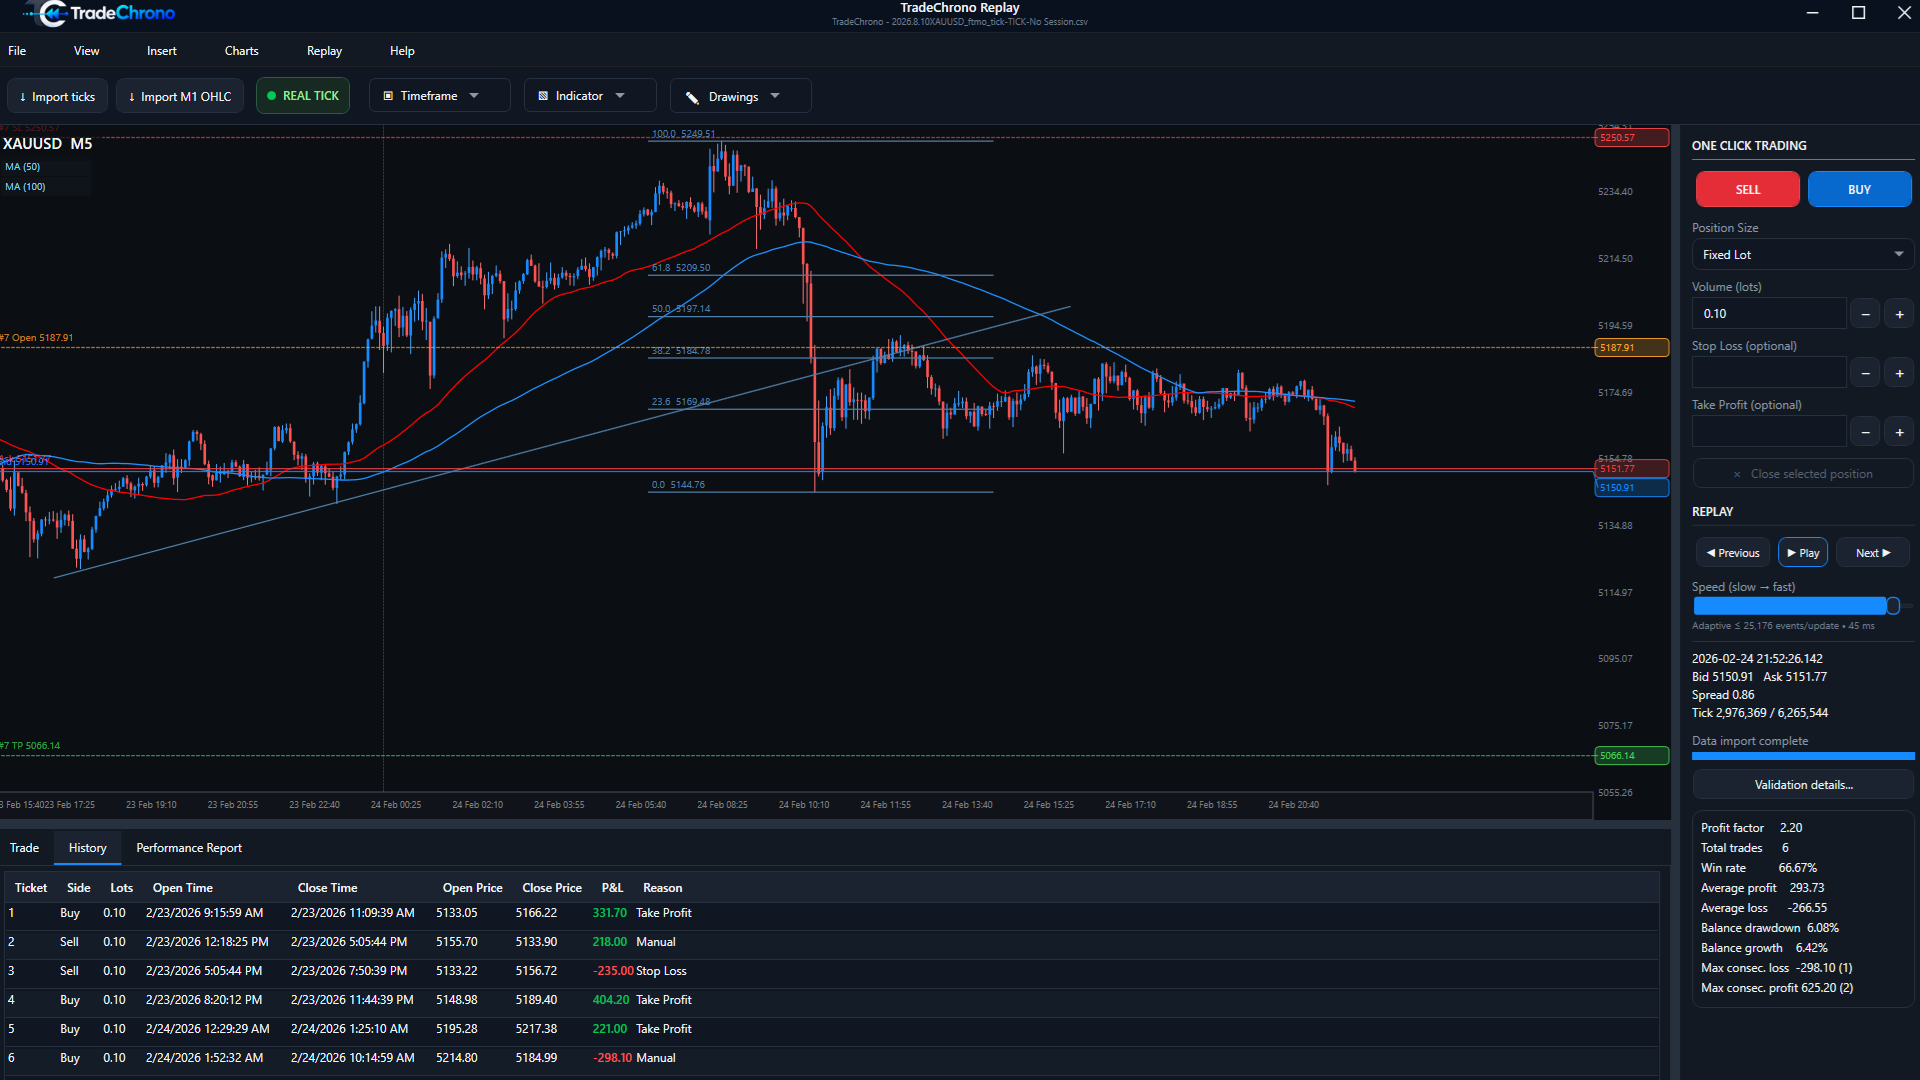
Review trade history
Compare entries, exits, costs and closing reasons in the historical record.
Real product screenshot · historical simulation 07 / 07
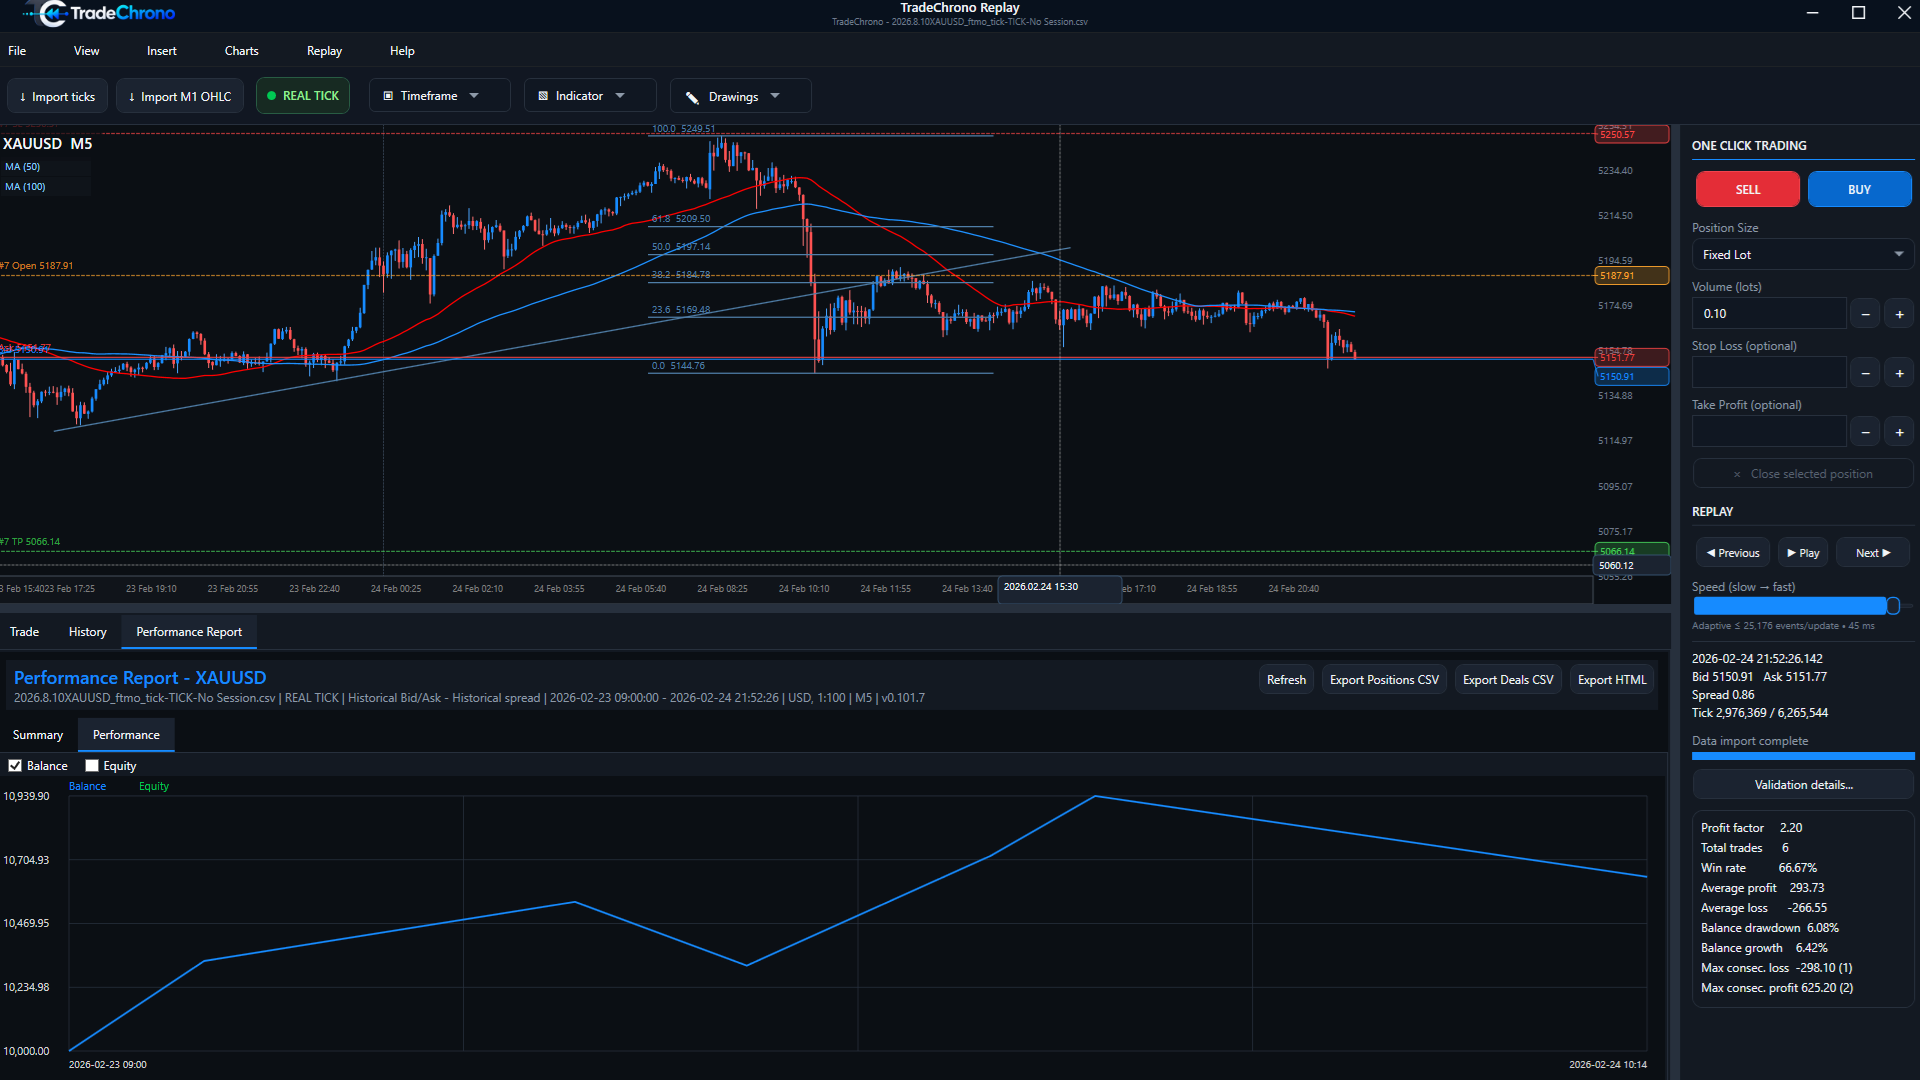
Analyze performance
Review the simulated balance/equity path alongside risk and trade metrics. Sample results are not expected future returns.
Real product screenshot · historical simulation