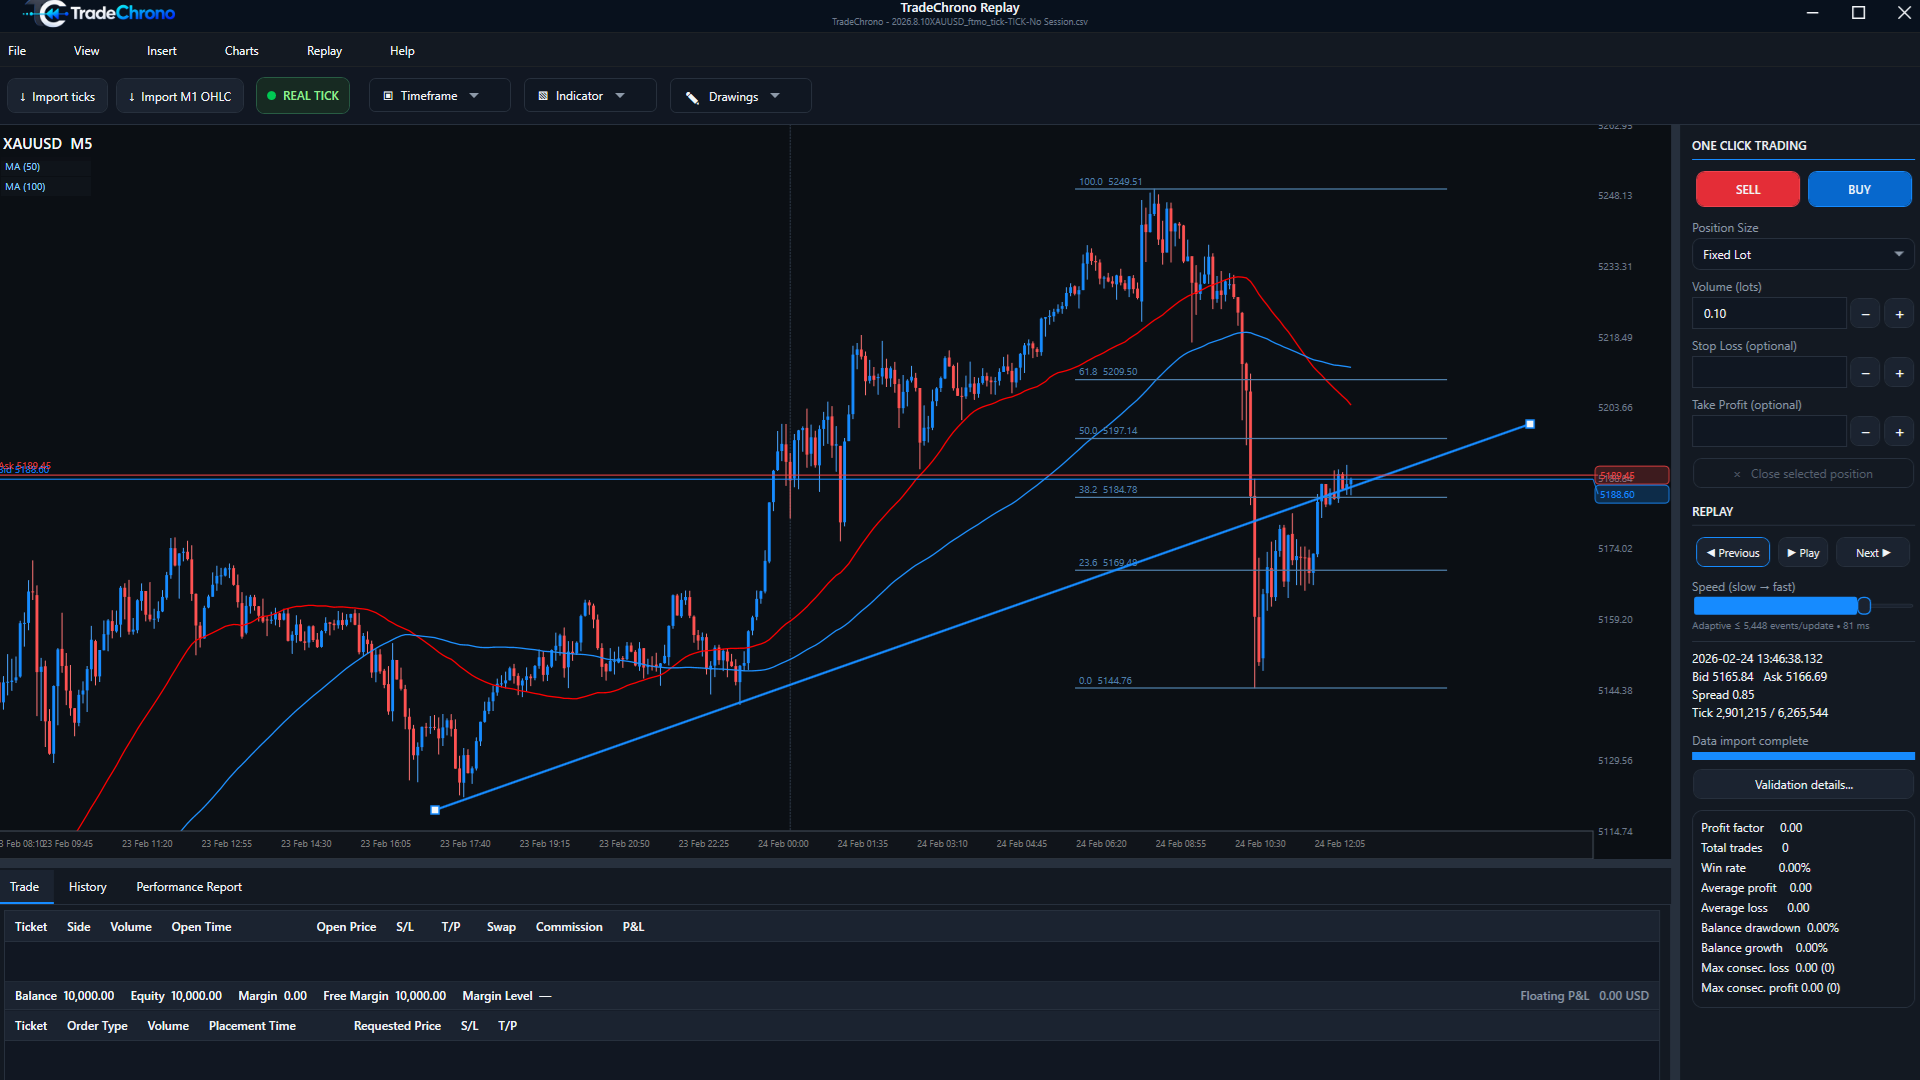
Timeframes and indicators
Choose a timeframe to inspect the historical candles at a useful scale. The approved interface shows moving averages, Bollinger Bands and RSI. Indicator values describe the loaded historical data; they are not trading recommendations.
Drawing tools
Use the Drawings menu for the tools available in your build. Trendline, Rectangle and Fibonacci are implemented drawing tools. Select a tool from Drawings and mark the price/time region on the chart. Use rectangles to mark an area and Fibonacci to inspect relative levels; compare the setup with later price action.
Avoid hindsight
Pause at the decision point and record your reasoning before advancing the replay. Keep your timeframe and analysis approach consistent when comparing sessions.