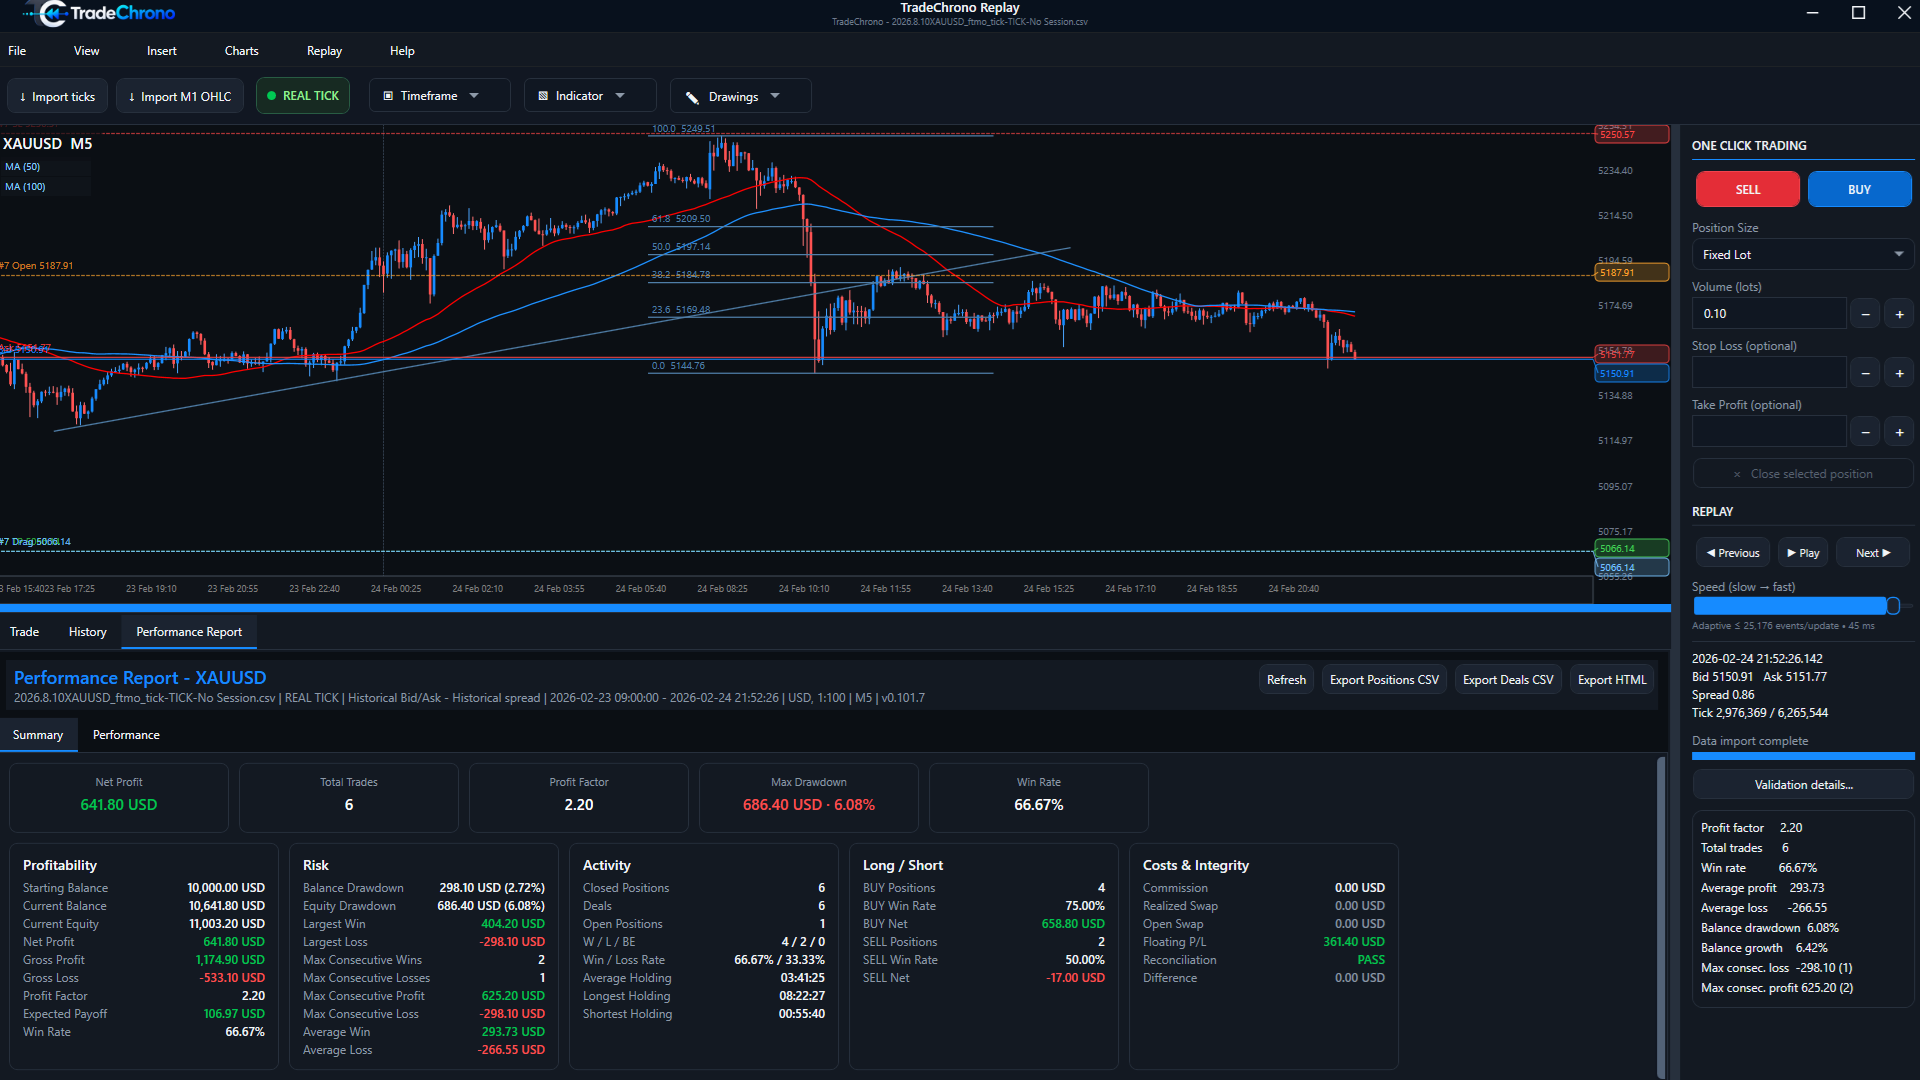
Summary and trade history
Review closed trades in History, including entry and exit times, prices, P&L and closing reason. Performance Report → Summary groups profitability, risk, activity, long/short results and costs. These are historical simulated outcomes, not expected customer returns.
Read metrics together
Balance tracks realized account results; equity also reflects open-position value. Drawdown describes decline from a peak. Win rate measures the share of winning trades, while profit factor compares gross profit with gross loss. Consider costs, sample size and data mode, not one headline number.
Performance and exports
Use the Performance tab to inspect the balance/equity path. Export Positions CSV or Deals CSV for further review, or Export HTML for an offline report. Keep exported reports with the session context so comparisons remain meaningful.